Automatic labeling units after spike sorting
This example shows how to automatically label units after spike sorting, using three different approaches:
Simple filter based on quality metrics
Bombcell: heuristic approach to label units based on quality and template metrics [Fabre]_
UnitRefine: pre-trained classifiers to label units as noise or SUA/MUA [Jain]_
import numpy as np

import spikeinterface as si
import spikeinterface.curation as sc
import spikeinterface.widgets as sw

from pprint import pprint
%matplotlib inline
analyzer_path = "/ssd980/working/analyzer_np2_single_shank.zarr"
sorting_analyzer = si.load(analyzer_path)
sorting_analyzer
SortingAnalyzer: 96 channels - 142 units - 1 segments - zarr - sparse - has recording
Loaded 14 extensions: amplitude_scalings, correlograms, isi_histograms, noise_levels, principal_components, quality_metrics, random_spikes, spike_amplitudes, spike_locations, template_metrics, template_similarity, templates, unit_locations, waveforms
The SortingAnalyzer includes several metrics that we can use for
curation:
sorting_analyzer.get_metrics_extension_data().columns
Index(['amplitude_cutoff', 'amplitude_cv_median', 'amplitude_cv_range',
       'amplitude_median', 'd_prime', 'drift_mad', 'drift_ptp', 'drift_std',
       'firing_range', 'firing_rate', 'isi_violations_count',
       'isi_violations_ratio', 'isolation_distance', 'l_ratio', 'nn_hit_rate',
       'nn_miss_rate', 'noise_cutoff', 'noise_ratio', 'num_spikes',
       'presence_ratio', 'rp_contamination', 'rp_violations', 'sd_ratio',
       'silhouette', 'sliding_rp_violation', 'snr', 'sync_spike_2',
       'sync_spike_4', 'sync_spike_8', 'exp_decay', 'half_width',
       'main_peak_to_trough_ratio', 'main_to_next_extremum_duration',
       'num_negative_peaks', 'num_positive_peaks',
       'peak_after_to_trough_ratio', 'peak_after_width',
       'peak_before_to_peak_after_ratio', 'peak_before_to_trough_ratio',
       'peak_before_width', 'peak_to_trough_duration', 'recovery_slope',
       'repolarization_slope', 'spread', 'trough_width', 'velocity_above',
       'velocity_below', 'waveform_baseline_flatness'],
      dtype='object')
1. Quality-metrics based curation
A simple solution is to use a filter based on quality metrics. To do so,
we can use the spikeinterface.curation.qualitymetrics_label_units
function and provide a set of thresholds.
qm_thresholds = {
    "snr": {"min": 5},
    "firing_rate": {"min": 0.1, "max": 200},
    "rp_contamination": {"max": 0.5}
}
all_metrics = sorting_analyzer.get_metrics_extension_data()
qm_labels = sc.threshold_metrics_label_units(all_metrics, thresholds=qm_thresholds, column_name="simple_threshold")
qm_labels["simple_threshold"].value_counts()
simple_threshold
noise    115
good      27
Name: count, dtype: int64
w = sw.plot_unit_labels(sorting_analyzer, qm_labels["simple_threshold"], ylims=(-300, 100))
w.figure.suptitle("Quality-metrics labeling")
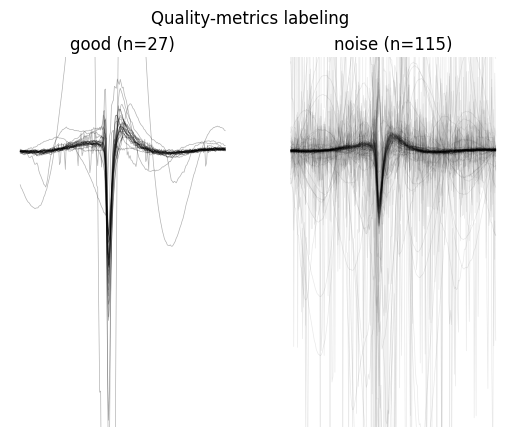
Only 27 units are labeled as good, and we can see from the plots that some “noisy” waveforms are not properly flagged and some visually good waveforms are labeled as noise. Let’s take a look at more powerful methods.
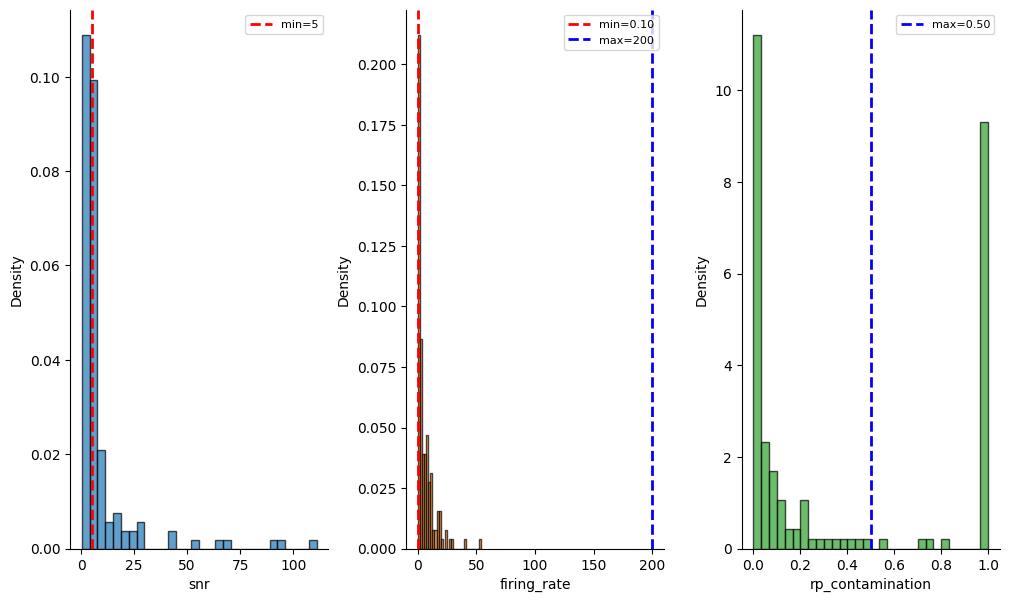
We can also check the distribution of the metrics and the thresholds across all units:
_ = sw.plot_metric_histograms(sorting_analyzer, qm_thresholds, figsize=(12, 7))
1. Bombcell
Bombcell ([Fabre]) is another threshold-based method that also uses
quality metrics and template metrics, but in a much more refined way! It
can label units as noise, mua, and good and further detect
non-soma units. It comes with some default thresholds, but
user-defined thresholds can be provided from a dictionary or a JSON
file.
bombcell_default_thresholds = sc.bombcell_get_default_thresholds()
pprint(bombcell_default_thresholds)
{'mua': {'amplitude_cutoff': {'max': 0.2, 'min': None},
         'amplitude_median': {'max': None, 'min': 40},
         'drift_ptp': {'max': 100, 'min': None},
         'num_spikes': {'max': None, 'min': 300},
         'presence_ratio': {'max': None, 'min': 0.7},
         'rp_contamination': {'max': 0.1, 'min': None},
         'snr': {'max': None, 'min': 5}},
 'noise': {'exp_decay': {'max': 0.1, 'min': 0.01},
           'num_negative_peaks': {'max': 1, 'min': None},
           'num_positive_peaks': {'max': 2, 'min': None},
           'peak_after_to_trough_ratio': {'max': 0.8, 'min': None},
           'peak_to_trough_duration': {'max': 0.00115, 'min': 0.0001},
           'waveform_baseline_flatness': {'max': 0.5, 'min': None}},
 'non-somatic': {'main_peak_to_trough_ratio': {'max': 0.8, 'min': None},
                 'peak_before_to_peak_after_ratio': {'max': 3, 'min': None},
                 'peak_before_to_trough_ratio': {'max': 3, 'min': None},
                 'peak_before_width': {'max': None, 'min': 0.00015},
                 'trough_width': {'max': None, 'min': 0.0002}}}
bombcell_labels = sc.bombcell_label_units(sorting_analyzer, thresholds=bombcell_default_thresholds, label_non_somatic=True, split_non_somatic_good_mua=True)
bombcell_labels["bombcell_label"].value_counts()
bombcell_label
mua             70
noise           50
good            21
non_soma_mua     1
Name: count, dtype: int64
w = sw.plot_unit_labels(sorting_analyzer, bombcell_labels["bombcell_label"], ylims=(-300, 100))
w.figure.suptitle("Bombcell labeling")
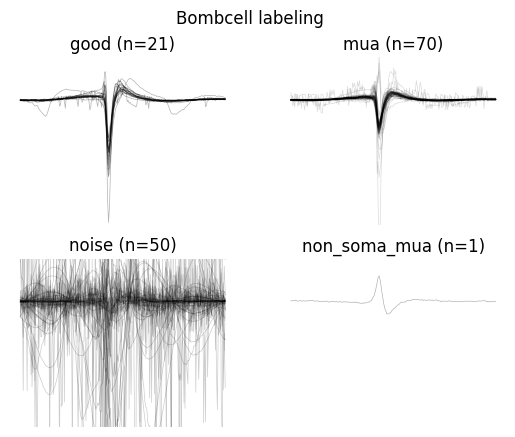
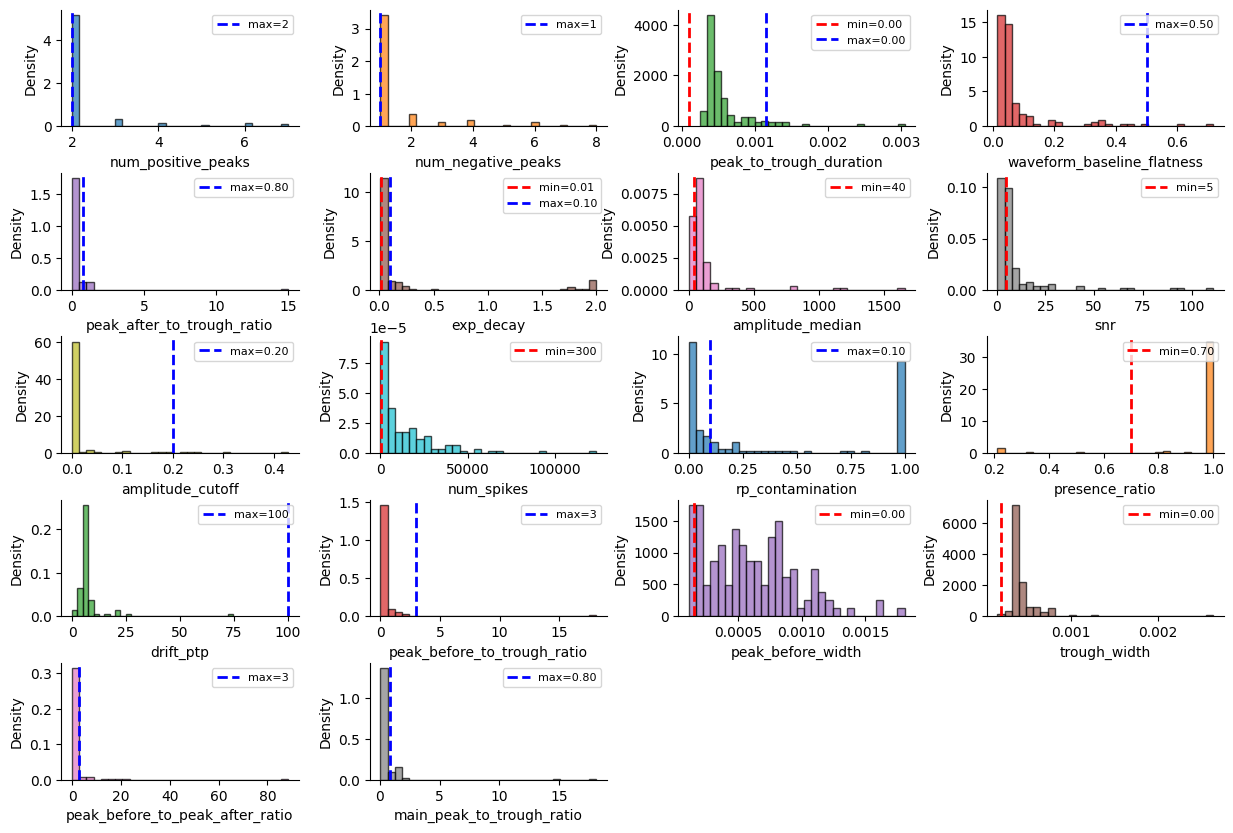
Bombcell uses many more metrics!
_ = sw.plot_metric_histograms(sorting_analyzer, bombcell_default_thresholds, figsize=(15, 10))
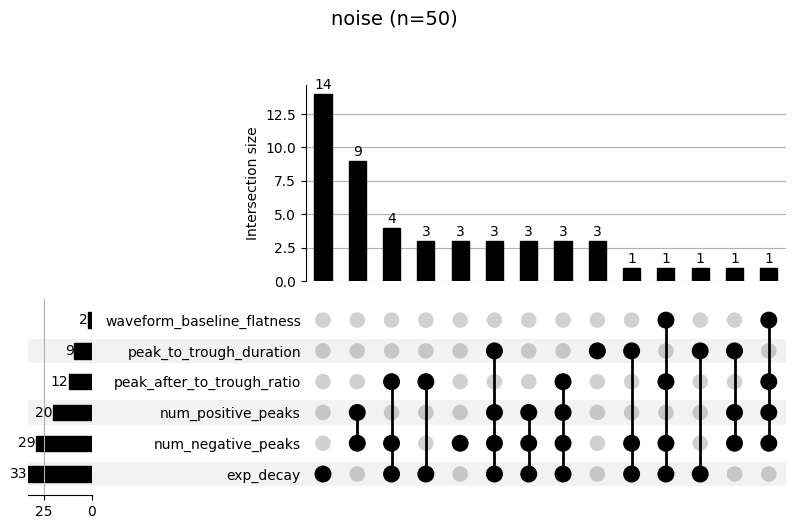
Bombcell also provides a specific widget to inspect the failure mode of
each labeling step. The upset plot shows the combination of metrics
that cause a failure (e.g. “noise” labeling). The top panel shows how
many units failed for that combination. For example, in the following
plot, we see that 9 units were labeled as “noise” because they didn’t
pass the num_positive_peaks and num_negative_peaks thresholds.
19 units were labeled as “mua” for poor SNR and high refractory period
contamination (rp_contamination).
_ = sw.plot_bombcell_labels_upset(sorting_analyzer, unit_labels=bombcell_labels["bombcell_label"], thresholds=bombcell_default_thresholds, unit_labels_to_plot=["noise", "mua"])

UnitRefine
UnitRefine ([Jain]) also uses quality and template metrics, but in a different way. It uses pre-trained classifiers to trained on hand-curated data. By default, the classification is performed in two steps: first a noise/neural classifier is applied, followed by a sua/mua classifier. Several models are available on the SpikeInterface HuggingFace page.
unitrefine_labels = sc.unitrefine_label_units(
    sorting_analyzer,
    noise_neural_classifier="SpikeInterface/UnitRefine_noise_neural_classifier",
    sua_mua_classifier="SpikeInterface/UnitRefine_sua_mua_classifier",
)
unitrefine_labels["unitrefine_label"].value_counts()
unitrefine_label
sua      62
noise    47
mua      33
Name: count, dtype: int64
w = sw.plot_unit_labels(sorting_analyzer, unitrefine_labels["unitrefine_label"], ylims=(-300, 100))
w.figure.suptitle("UnitRefine labeling")
This “How To” demonstrated how to automatically label units after spike sorting with different strategies. We recommend running Bombcell and UnitRefine as part of your pipeline. These methods will facilitate further curation and make downstream analysis cleaner.
To remove units from your SortingAnalyzer, you can simply use the
select_units function:
Remove units from SortingAnalyzer
After auto-labeling, we can easily remove the “noise” units for downstream analysis:
non_noisy_units = bombcell_labels["bombcell_label"] != "noise"
sorting_analyzer_clean = sorting_analyzer.select_units(sorting_analyzer.unit_ids[non_noisy_units])
sorting_analyzer_clean
SortingAnalyzer: 96 channels - 92 units - 1 segments - memory - sparse - has recording
Loaded 14 extensions: random_spikes, waveforms, templates, amplitude_scalings, correlograms, isi_histograms, noise_levels, principal_components, spike_amplitudes, spike_locations, quality_metrics, template_metrics, template_similarity, unit_locations