Template Metrics
This extension computes commonly used template metrics. A template is the average (or median) spike waveform for each unit.
First, the templates are upsampled (optionally, default 10) to increase the temporal resolution for more precise metric computation.
We compute the channel where the extremal value of your template occurs. Many single channel metrics only depend on the template on this channel, while multi-channel metrics will depend on the templates from many channels of your probe. On the extremal channel, we compute the troughs (minima) and peaks (maxima) of the template.
Peaks are divided into “peaks before trough” and “peaks after trough”, depending on their temporal location with respect to the main trough.
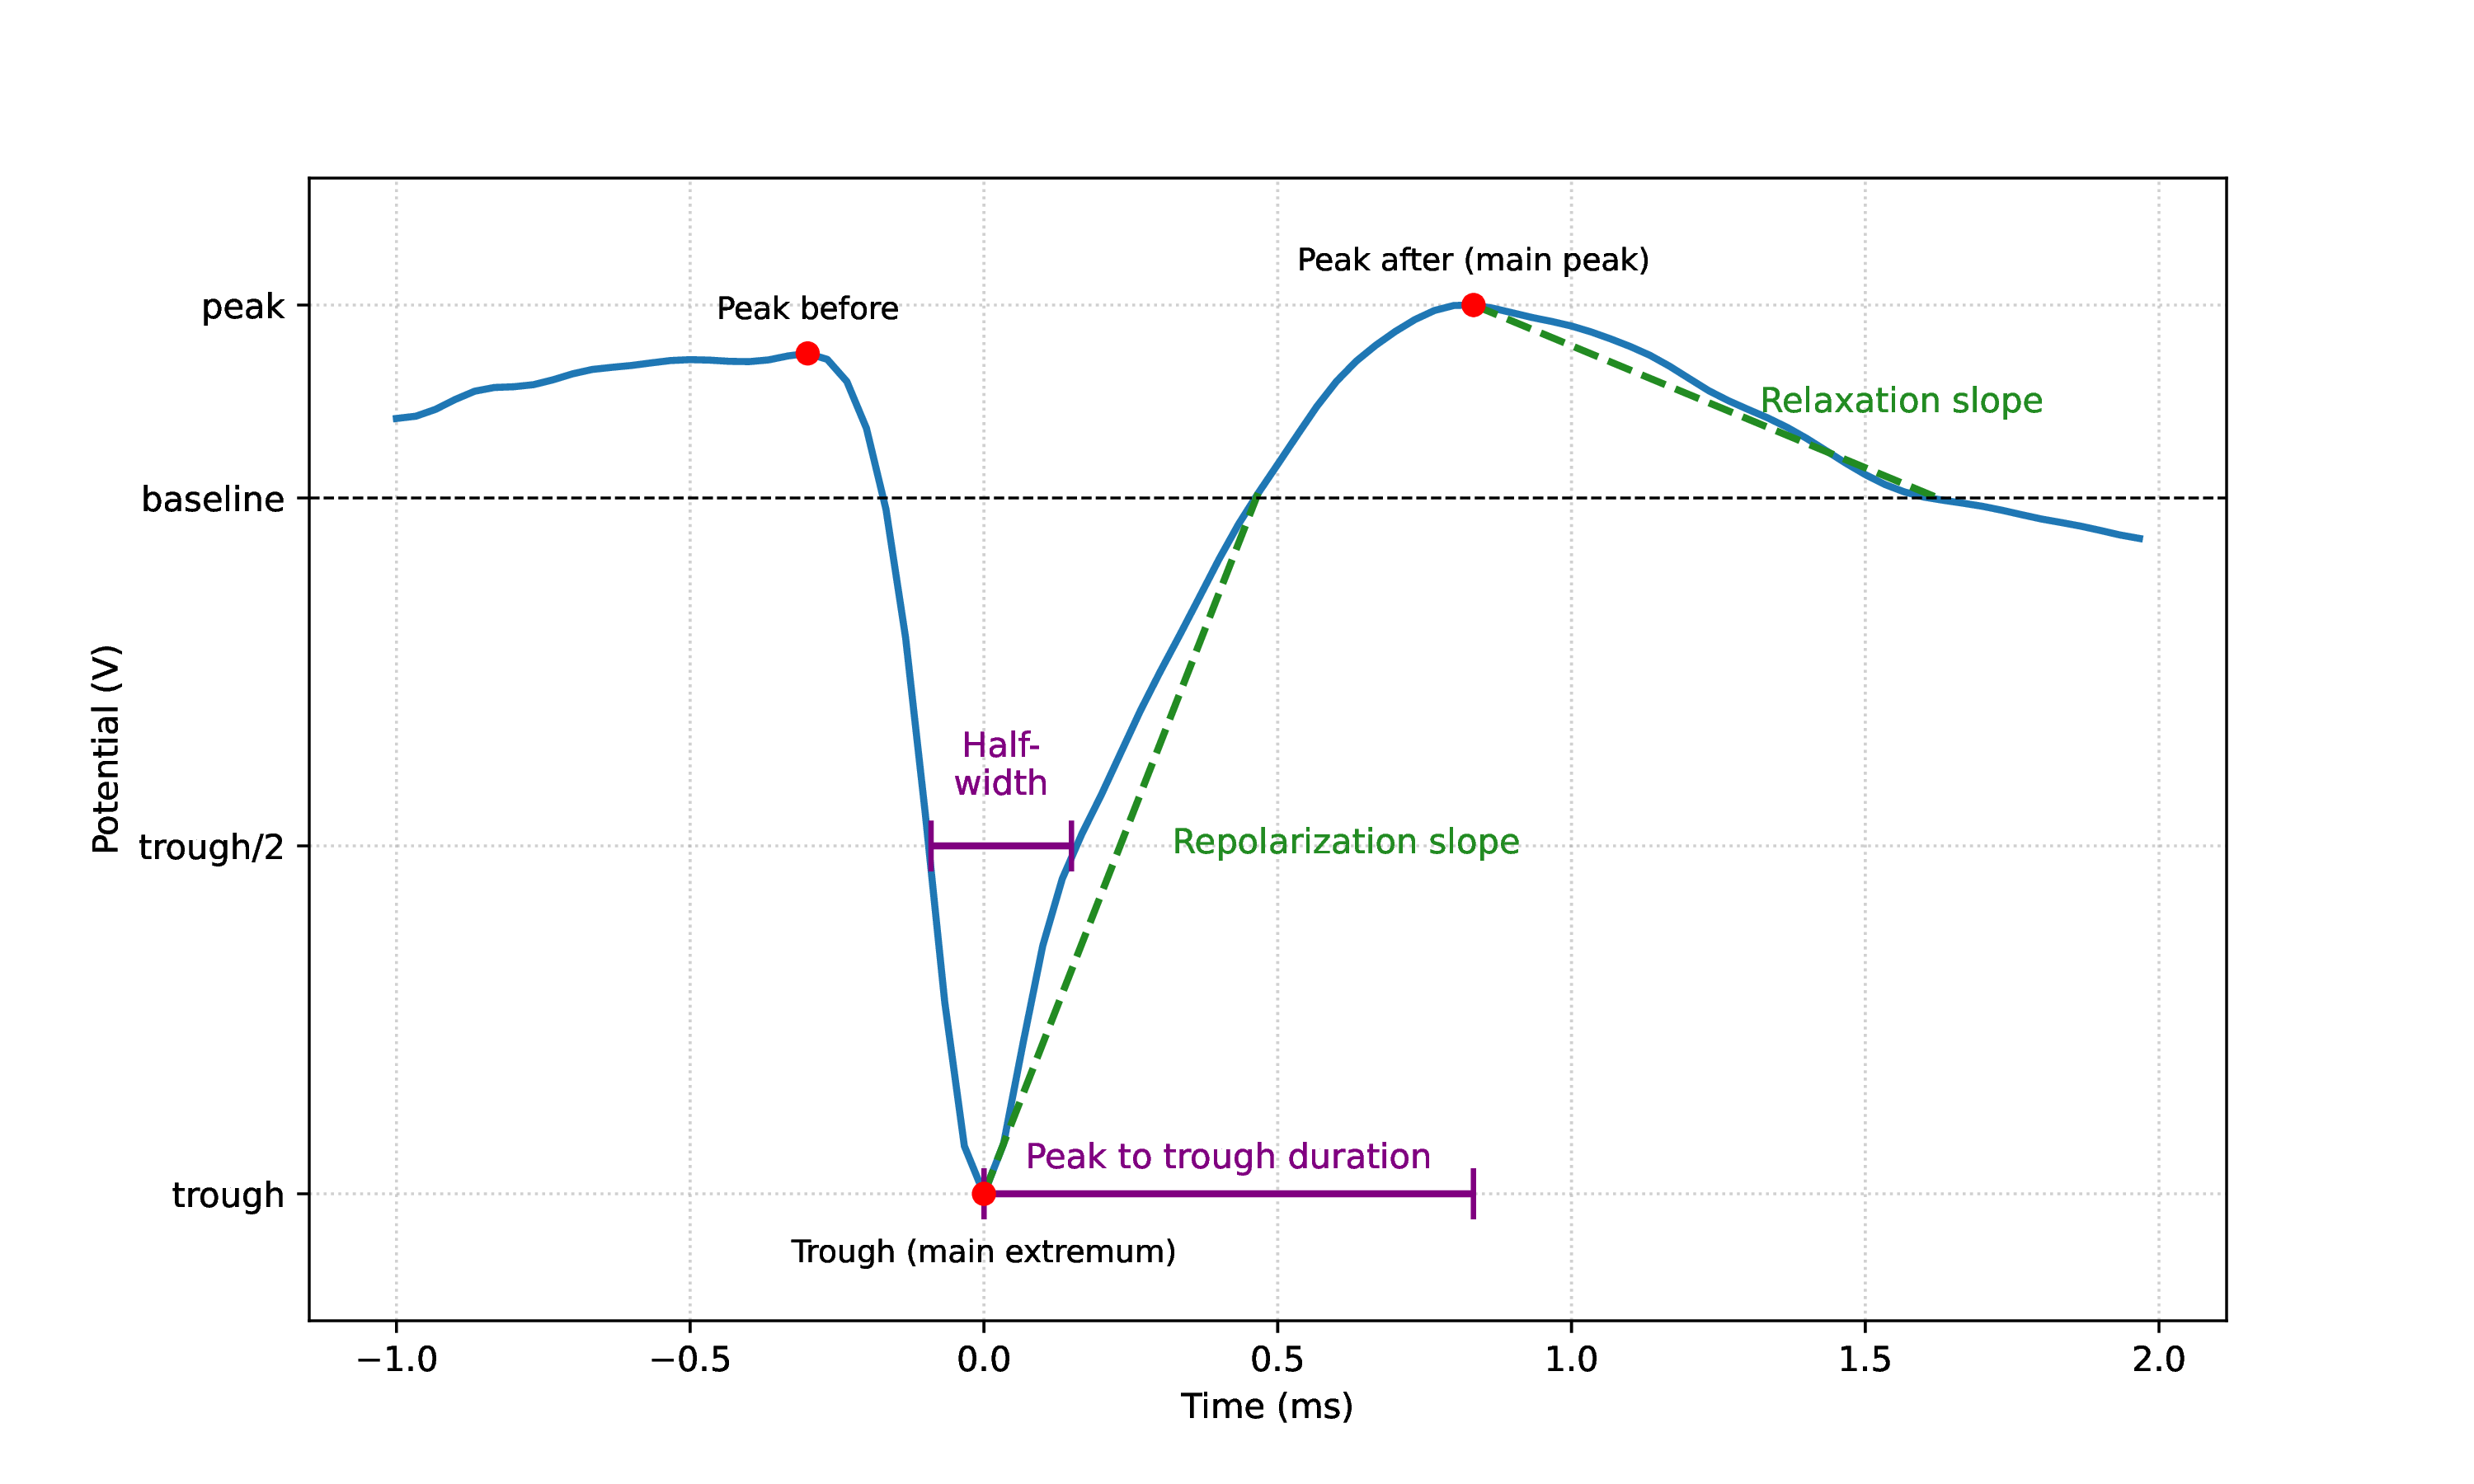
Visualization of trough, peaks, and a few metrics.
The detection of the trough, peak before and peak after was adopted from Bombcell [Fabre].
Here is a list of metrics computed using the template on the main extremum channel:
half_width
Duration in seconds at half the amplitude of the largest trough (minimum) and peak of the template.
It generates two columns: trough_half_width and peak_half_width.
peak_to_trough_duration
Duration in seconds between the main trough and the main peak after the trough.
Warning
This metric was renamed in version 0.104.0 from peak_to_valley.
main_to_next_extremum_duration
Duration in seconds from the main extremum (peak or trough) to the next (in time) extremum.
If no next extremum is found, it returns NaN. Ported from Bombcell [Fabre].
repolarization_slope
Slope of the repolarization phase of the template, between the trough (minimum) and return to baseline in µV/s. If there is no trough, it returns NaN. If the absolute maximum is a peak, it still uses largest trough to compute.
recovery_slope
Slope of the recovery phase of the template, from the first peak following the largest trough, returning to baseline in µV/s. If there is no trough, it returns NaN. If there is no peak after the main trough, it returns NaN.
Note
The units of recovery_slope and repolarization_slope depend on the
input. Voltages are based on the units of the template. By default this is µV
but can be the raw output from the recording device (this depends on the
return_in_uV parameter, read more here: SortingAnalyzer).
Distances are in µm and times are in seconds. So, for example, if the
templates are in units of µV then recovery_slope repolarization_slope is in
µV/s.
waveform_ratios
This metric includes several ratios between peaks and troughs.
These metrics are ported from Bombcell [Fabre].
main_peak_to_trough_ratio
Ratio between the amplitude of the main peak (before or after trough) and the absolute amplitude of the largest trough. If no troughs, or no peaks are found, it returns NaN.
Warning
This metric was renamed in version 0.104.0 from peak_trough_ratio. The previous implementation returned a
negative value, but the current implementation uses absolute values for the calculation,
so it returns a positive value.
peak_before_to_trough_ratio
Ratio between the amplitude of the peak before the main trough and the absolute amplitude of the largest trough. If no troughs, or no peaks before trough are found, it returns NaN.
peak_after_to_trough_ratio
Ratio between the amplitude of the peak after the main trough and the absolute amplitude of the largest trough. If no troughs, or no peaks after trough are found, it returns NaN.
peak_before_to_peak_after_ratio
Ratio between the amplitude of the peak before the main trough and the amplitude of the peak after the main trough. If no troughs, or no peaks before trough or no peaks after trough, it returns NaN.
waveform_widths
This metric includes the widths of peaks and troughs, given by the scipy.signal.find_peaks function.
These metrics are ported from Bombcell [Fabre].
trough_width
Width in seconds of largest trough.
peak_before_width
Width in seconds of peak before largest trough.
peak_after_width
Width in seconds of peak after largest trough.
number_of_peaks
This metric includes the number of positive and negative peaks in the waveform:
num_positive_peaks and num_negative_peaks.
For recordings with a large number of channels, it can be useful to compute
multi-channel metrics that take into account the spatial distribution of the
template across the probe (these are computed by default if the number of channels
is greater than 64, but can be forced on or off with the include_multi_channel_metrics
parameter).
These are the multi-channel metrics that can be computed:
velocity_fits
Computes the velocity of the template propagation along the probe using a linear fit of the time delays of the
troughs across channels versus the distance from the channel with the largest amplitude.
It returns two columns: velocity_above and velocity_below, which are the velocities in µm/ms above and
below the max channel of the template, respectively.
exp_decay
Exponential decay in 1/µm of the template amplitude over distance from the channel with the largest amplitude. Optionally, the fit can also be linear (default is exponential).
spread
Spread in µm of the template amplitudes, defined as the distance between the channels “observing” a template above 20% of the maximum amplitude (default). Template amplitudes are normalized to the maximum amplitude and optionally smoothed over space using a Gaussian filter (default sigma is 20µm).
tm = sorting_analyzer.compute(input="template_metrics", include_multi_channel_metrics=True)
For more information, see compute_template_metrics()